Since the early 2000s, there has been a steady increase in the use of home delivery services for buying groceries. This has had impacts on the footfall traffic inside supermarkets. It has also changed the way many of the big retailers have sought to expand, with some trending towards smaller convenience stores whilst allowing the ‘big weekly shop’ to be accommodated by online services and home deliveries. This dependence on online deliveries was accelerated during the COVID-19 pandemic, but has this shift stuck around post-pandemic? Mayer Brown investigates below what the impact of increased home deliveries is on parking demand at supermarkets, and whether some food retailers could afford to reduce their car park sizes in order to accommodate other facilities.
Wider Shopping Trends
Recent years have shown a significant rise in online shopping and home delivery services, alongside a corresponding decrease in vehicle trips to food stores. This, therefore, generates a reduced demand for parking at supermarkets - as more people get home delivery to produce, fewer people travel by private car to the store.
Data from the Office for National Statistics (ONS) Retail Sales Index (RSI) and the Department for Transport’s (DfT) National Travel Survey (NTS) have been used to illustrate this trend below.
Retail Sales Index
The ONS’ RSI features a large amount of data on British shopping habits. Its workbook of tables ‘Internet Retail Sales by Sector’ features ‘Table 4 - VALUE SEASONALLY ADJUSTED - Internet Retail Sales in £thousands, Great Britain’. For the category ‘Predominantly food stores’ (AGG1), the ONS provides monthly data from March 2009 up to March 2022. This information provides a good indication of the level of uptake of home delivery food retail, though as it is based on value rather than volume, the effect of inflation has to be considered and there will not be a 1-to-1 correlation with a loss of shopping trips to supermarkets.
This data has been plotted in Figure 1 below – the light blue line indicates every value as recorded in the dataset. In contrast, the dark blue constitutes a 6-month average trendline, which smooths the data and provides a more coherent trend independent of typical fluctuations in purchasing:
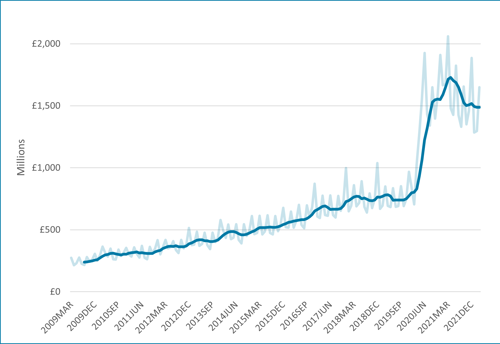
Figure 1: Office for National Statistics Retail Sales Index - Internet Retail Sales, Great Britain – Predominantly Food Stores
It is clear that the start of the pandemic caused a significant uplift in the use of online shopping, however, the data from 2009 to 2019 shows a gradual increase in the use of online shopping (assuming a strong correlation between the value of sales and the use of online shopping).
While there has been some drop-off in online shopping since the peak in March 2021, it is not close to having fallen to pre-pandemic levels and it is reasonable to expect that online shopping activity will not decrease to pre-2020 levels again.
National Travel Survey
The DfT collects annual travel data for its NTS, which can be broken down by trip purpose and mode of transport.
Figure 2 below indicates the average number of shopping trips per person per year made by various forms of transport, from 2002 to 2021:

Figure 2: Shopping Trips per Person per Year, 2002-2021
While the most dramatic change in shopping travel patterns occurs in 2020 and 2021 (likely due to the impact of the pandemic), there is a clear overall decline in shopping trips between the early 2000s and the present day. It is expected this can be attributed to the gradual increase in online shopping seen in Figure 1.
It is also notable that while trips for travel modes such as walking, cycling and bus travel have increased in 2021 compared to 2020, private car travel for shopping trips declined even further.
This paints an overall picture of less individuals travelling to supermarkets by private vehicles, due to the rise in online shopping, which has been escalated by the pandemic.
Supermarket Parking Beat Survey Data
Mayer Brown has conducted its own analysis of supermarket parking data for 7 supermarket sites for which we have historic parking beat survey data. These sites have been selected primarily on availability of data, but all share a number of traits, as they are large food retail supermarkets with car parks of between 250 and 650 parking bays.
All of the sites used have been surveyed in 2021 or 2022 in order to ensure any analysis captures the impact of the COVID-19 pandemic. For surveys of multiple days, only the highest recorded parking occupation across those days has been used.
Figure 3 below shows the maximum parking occupancies at these supermarkets over time, from the late 90s to the present day:

Figure 3: Maximum Parking Occupancy Over Time
These sites can be broadly summarised into two camps:
- Supermarkets with an obvious decrease in parking over time since the early 2000s (Sites 1, 2, 5 and 7), and
- Supermarkets with a parking occupancy peak in the early 2010s that have since decreased in occupancy (Sites 3, 4 and 6).
For both categories, it is clear to assert from Figure 3 that parking demand at these sites has decreased since the early 2010s.
Given that online shopping has only been considered a statically significant method of grocery shopping since 2009 (inferred from the fact that the ONS data extends only as far back as 2009 – see Figure 1), it is not unexpected to see this trend towards lower parking demand only strongly exhibit since the early 2010s.
Notably further is that (excepting for Site 6’s outlier in 2002), for each site, the parking occupancy survey data collected since 2020 (and therefore since the pandemic) constitutes the lowest recorded parking occupancy of any of their surveys. This is significant as it is exhibited at all stores, and correlates well with the expected trend based on Figures 1 and 2.
Given the span of time over which these surveys have been undertaken, all of these stores have experienced changes in retail floor area and in car park capacity, and these factors may have an impact on the attractiveness of the store and therefore the parking demand that the store incurs. Notably all of these stores experienced increases in the size of retail floor area between 2000 and 2010, though this resulted in increases in parking demand at only some of the stores.
Further Graphs on Supermarket Parking Occupancy
For ease of viewing and reference, the survey data for the two store categories are separated into separate graphs below:

Figure 4: Maximum Parking Occupancy Over Time – Sites with Consistent Decreases

Figure 5: Maximum Parking Occupancy Over Time – Sites with Peaks in Demand in the Early 2010s
Site 5 has the potential to be categorised in either camp, but given its 1997 surveys are broadly equivalent to its 2011 survey, it is considered more fitting to view the data as presenting a long-term decrease with an outlier survey in 2011 - it is important to remember that this data analysis is highly sensitive to noise, given the long timeframes, limited snapshots of data, and many factors that can influence parking demand at a food retail site.
For Sites 1, 2 and 7, there is a clear downward trend in maximum parking occupancy since peaks at the turn of the millennium. This is most pronounced for Site 1, which despite some potential outliers, shows a significant reduction from the height of its parking occupancy in 1998.
Site 2 exhibits a more gradual decrease between 1995 and 2018 (excepting for an outlier in 2005), followed by a more significant drop in parking demand between 2018 and 2021. Site 7 has outlier surveys in 1998 and 2003, but these ultimately do not affect the clear overall picture of a downward trend, with the lowest parking demands exhibited following the pandemic.
Sites 3, 4 and 6 all show peaks in parking demand in the 2011-2014 period – which reflects the increased sizes of these stores due to improvements made over the 2000s and 2010s. However, despite this increase in floorspace, all three exhibit decreases in demand since this point, especially since the pandemic.
Notably, the sites in Figure 4 with peaks in the 90s and 00s are all in the London or the South East, whereas the sites in Figure 5 with peaks in the 10s are based elsewhere in the country. This may be indicative of a wider pattern, but further investigation would be necessary to draw any strong conclusions.
For all seven sites there is an evident trend towards a decrease in parking demand since 2014, and a significant drop in demand since the pandemic.
Summary and Conclusions of Trends in Supermarket Parking Demand
The national data presented in Figures 1 and 2 indicate a trend away from private vehicle trips to the supermarket, in favour of online shopping. This trend also appears to be reflected in the parking survey data in Figure 3.
Data analysis based on a small sample set can only be taken so far, so it would not be prudent to estimate what the percentage reduction in demand at stores has been based on this data alone – however Mayer Brown considers that this analysis is sufficient to demonstrate the following statement:
“Since 2014, there has been a general decrease in parking demand at large supermarkets, and this is likely attributed to the increase in home deliveries of groceries. This trend was accelerated by the COVID-19 pandemic, which saw a significant increase in the uptake of grocery home deliveries.”
For more information, please contact George Stow at gstow@mayerbrown.co.uk. For any other enquiries or help with your Transport Planning project, please call 01483 750508 or fill out our form and we’ll assist you.
Author: George Stow